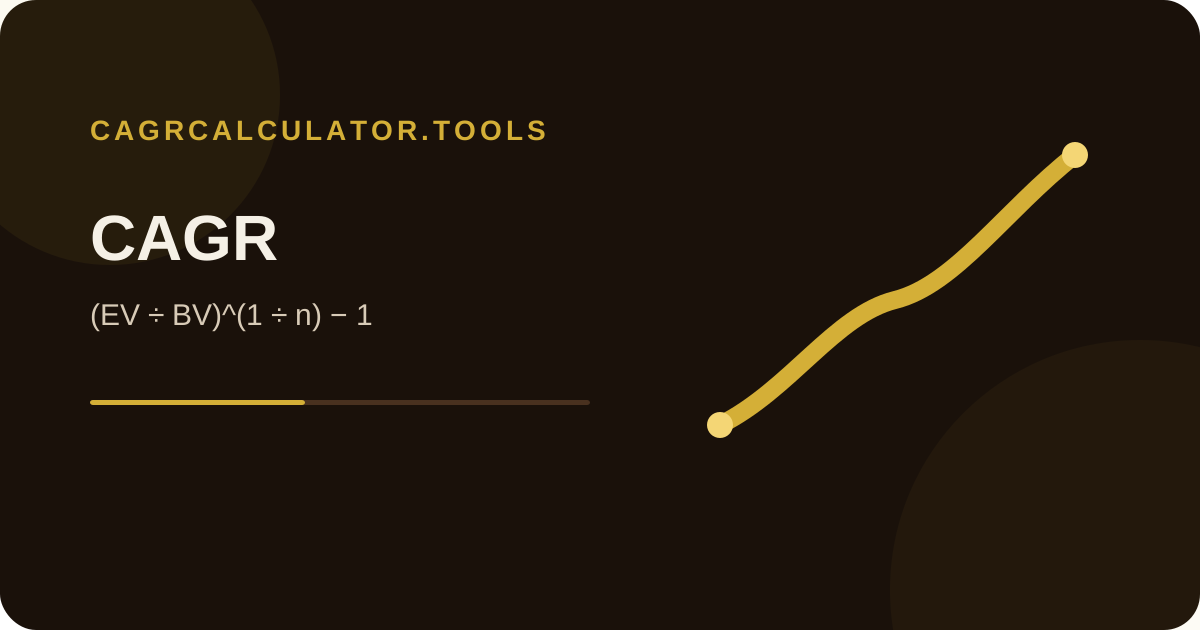
What the CAGR formula measures
CAGR answers a narrow question: what single, constant annual compound rate would connect a beginning value to an ending value over a specified period? It converts total multi-year change into an annualized rate. It does not claim that the value actually changed by that percentage in every year.
That distinction matters for volatile investments, business revenue, website traffic, users, salaries, market size, or any other series that can rise and fall between the first and last observation. The formula uses only the endpoints and elapsed time, so the path between them is intentionally ignored.
The formula and variables
| Symbol | Meaning | Requirement |
|---|---|---|
| BV | Beginning value | Must be greater than zero for the standard formula |
| EV | Ending value | Can be above or below BV; this calculator also permits zero |
| n | Elapsed years | Must be greater than zero |
Worked example: $10,000 to $16,000 in four years
Substitute the three inputs into the formula:
CAGR = (16,000 ÷ 10,000)^(1 ÷ 4) − 1
CAGR = 1.6^0.25 − 1
CAGR ≈ 0.12468265 = 12.4683%
The total increase is 60%, but the compound annual rate is about 12.47%. Dividing 60% by four would give 15%, which is not the compound annual growth rate because it ignores compounding.
Count growth intervals, not labels
One of the most common CAGR mistakes is counting the number of year labels instead of the number of elapsed growth periods. If a value is measured on the same date in 2021 and again on the same date in 2026, five years have elapsed. The labels 2021, 2022, 2023, 2024, 2025, and 2026 are six observations or calendar labels, but they span five one-year intervals.
When dates do not line up exactly, use an explicit day-count method rather than guessing whether the period should be rounded up or down. The exact-date mode on this site uses actual elapsed days divided by 365, documented on the methodology page.
Negative CAGR
CAGR can be negative. If a value falls from 100 to 75 over three years, the formula is (75 ÷ 100)^(1 ÷ 3) − 1, which is approximately -9.14% per year. The negative sign describes an annualized decline connecting the two endpoints; it does not mean each individual year fell by exactly 9.14%.
If the ending value is zero and the beginning value is positive, the endpoint represents a complete loss and the standard formula resolves to -100%. Values below zero require a different interpretation and are outside the assumptions of this calculator.
Months, days, and partial years
The formula does not require n to be a whole number. Eighteen months can be represented as 1.5 years. The manual-duration mode on this site converts months to years by dividing by 12 and days by 365, then adds those fractions to any whole years entered.
For exact start and end dates, the calculator uses ACT/365 Fixed. Different financial systems can use different day-count conventions, so small differences between exact-date tools are possible even when the beginning and ending values are identical.
What CAGR leaves out
CAGR is useful because it is compact, but the same simplicity creates limitations. It does not reveal volatility, the sequence of yearly returns, drawdowns, fees, taxes, inflation, or intermediate deposits and withdrawals. It should not be interpreted as a forecast merely because it summarizes historical growth.
If money moved into or out of an investment on different dates, a cash-flow-aware measure such as XIRR can answer a different and often more relevant question. If you only need total gain relative to the starting amount and do not need annualization, ROI may be the simpler metric.