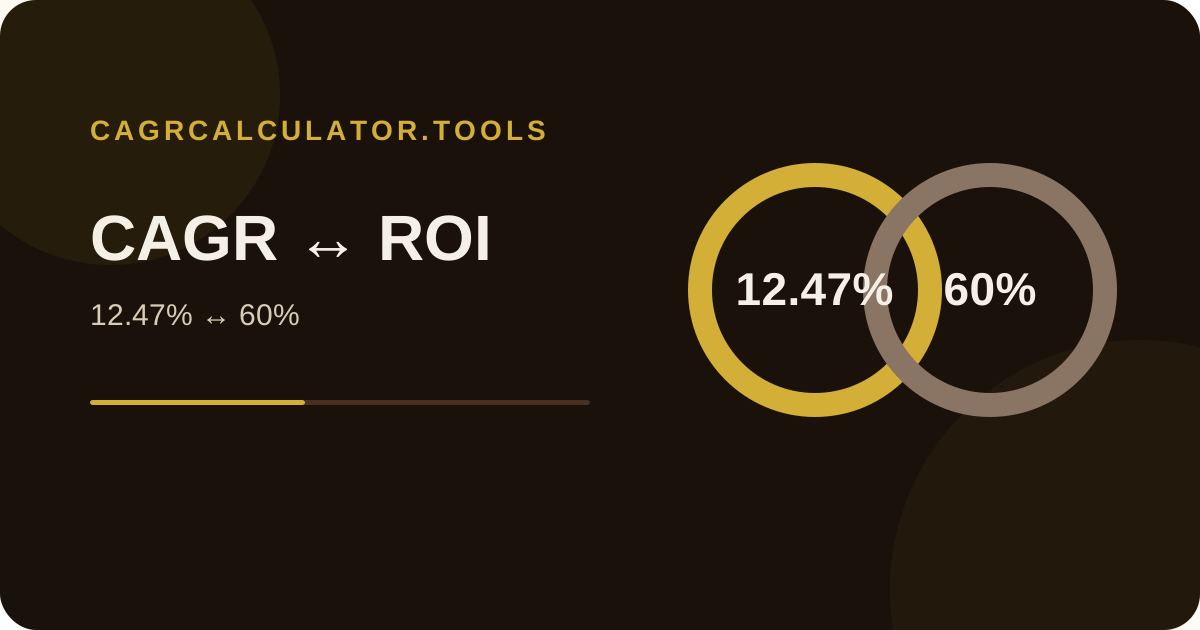
CAGR and ROI answer different questions
| Metric | Main question | Uses time? | Compounds? |
|---|---|---|---|
| ROI | How much did the value gain or lose relative to the starting amount? | No, in its basic form | No |
| CAGR | What constant annual compound rate connects the beginning and ending values? | Yes | Yes |
ROI formula
For a simple beginning and ending value with no additional cash flows, ROI can be expressed as total gain divided by the beginning value:
If $10,000 becomes $16,000, the gain is $6,000. Divide $6,000 by $10,000 and the ROI is 60%. That result says nothing about whether the gain took one year, four years, or ten years.
CAGR formula
CAGR adds the elapsed period and annualizes the endpoint change:
If the same $10,000 becomes $16,000 over four years, the CAGR is approximately 12.47%. The 60% ROI and 12.47% CAGR are both correct because they describe different dimensions of the same outcome.
Worked comparison: 60% ROI vs 12.47% CAGR
ROI
60%
Total gain relative to the $10,000 beginning value.
CAGR
12.47%
Constant annual compound rate over four years.
Neither number replaces the other. ROI is intuitive for answering “how much did I gain overall?” CAGR is more useful for answering “what annual compound pace produced that result?”
Why time changes the comparison
Consider two outcomes with the same 50% ROI. In both cases, $10,000 becomes $15,000. If the first takes two years, its CAGR is about 22.47%. If the second takes five years, its CAGR is only about 8.45%.
| Beginning | Ending | Time | ROI | CAGR |
|---|---|---|---|---|
| $10,000 | $15,000 | 2 years | 50% | 22.47% |
| $10,000 | $15,000 | 5 years | 50% | 8.45% |
Basic ROI treats those outcomes as equal. CAGR exposes the difference in speed by annualizing the result.
When ROI is more useful
ROI is useful when the total gain relative to cost is the main question and the time dimension is secondary. It is common for projects, marketing campaigns, equipment purchases, or other decisions where people want a simple ratio of benefit to cost.
The exact ROI definition can vary by context because “gain,” “cost,” and included expenses may be defined differently. When comparing ROI figures from different sources, make sure the underlying cost and benefit definitions are consistent.
When CAGR is more useful
CAGR is useful for multi-year growth comparisons: business revenue, user counts, market size, investment values, or other positive endpoint measures. Because it incorporates elapsed time, it lets you compare growth periods of different lengths more meaningfully than total ROI alone.
CAGR still has important limits. It smooths the path, hides volatility, and does not account for intermediate cash flows. For a portfolio with contributions or withdrawals on different dates, XIRR can be a better fit than either simple ROI or endpoint CAGR.
Use both when they add context
A clear performance summary can report both total growth and CAGR. For example: “The value increased 60% in total, from $10,000 to $16,000, equivalent to a 12.47% CAGR over four years.” That sentence preserves the intuitive total change while also showing the annualized compound pace.